Understanding the interface
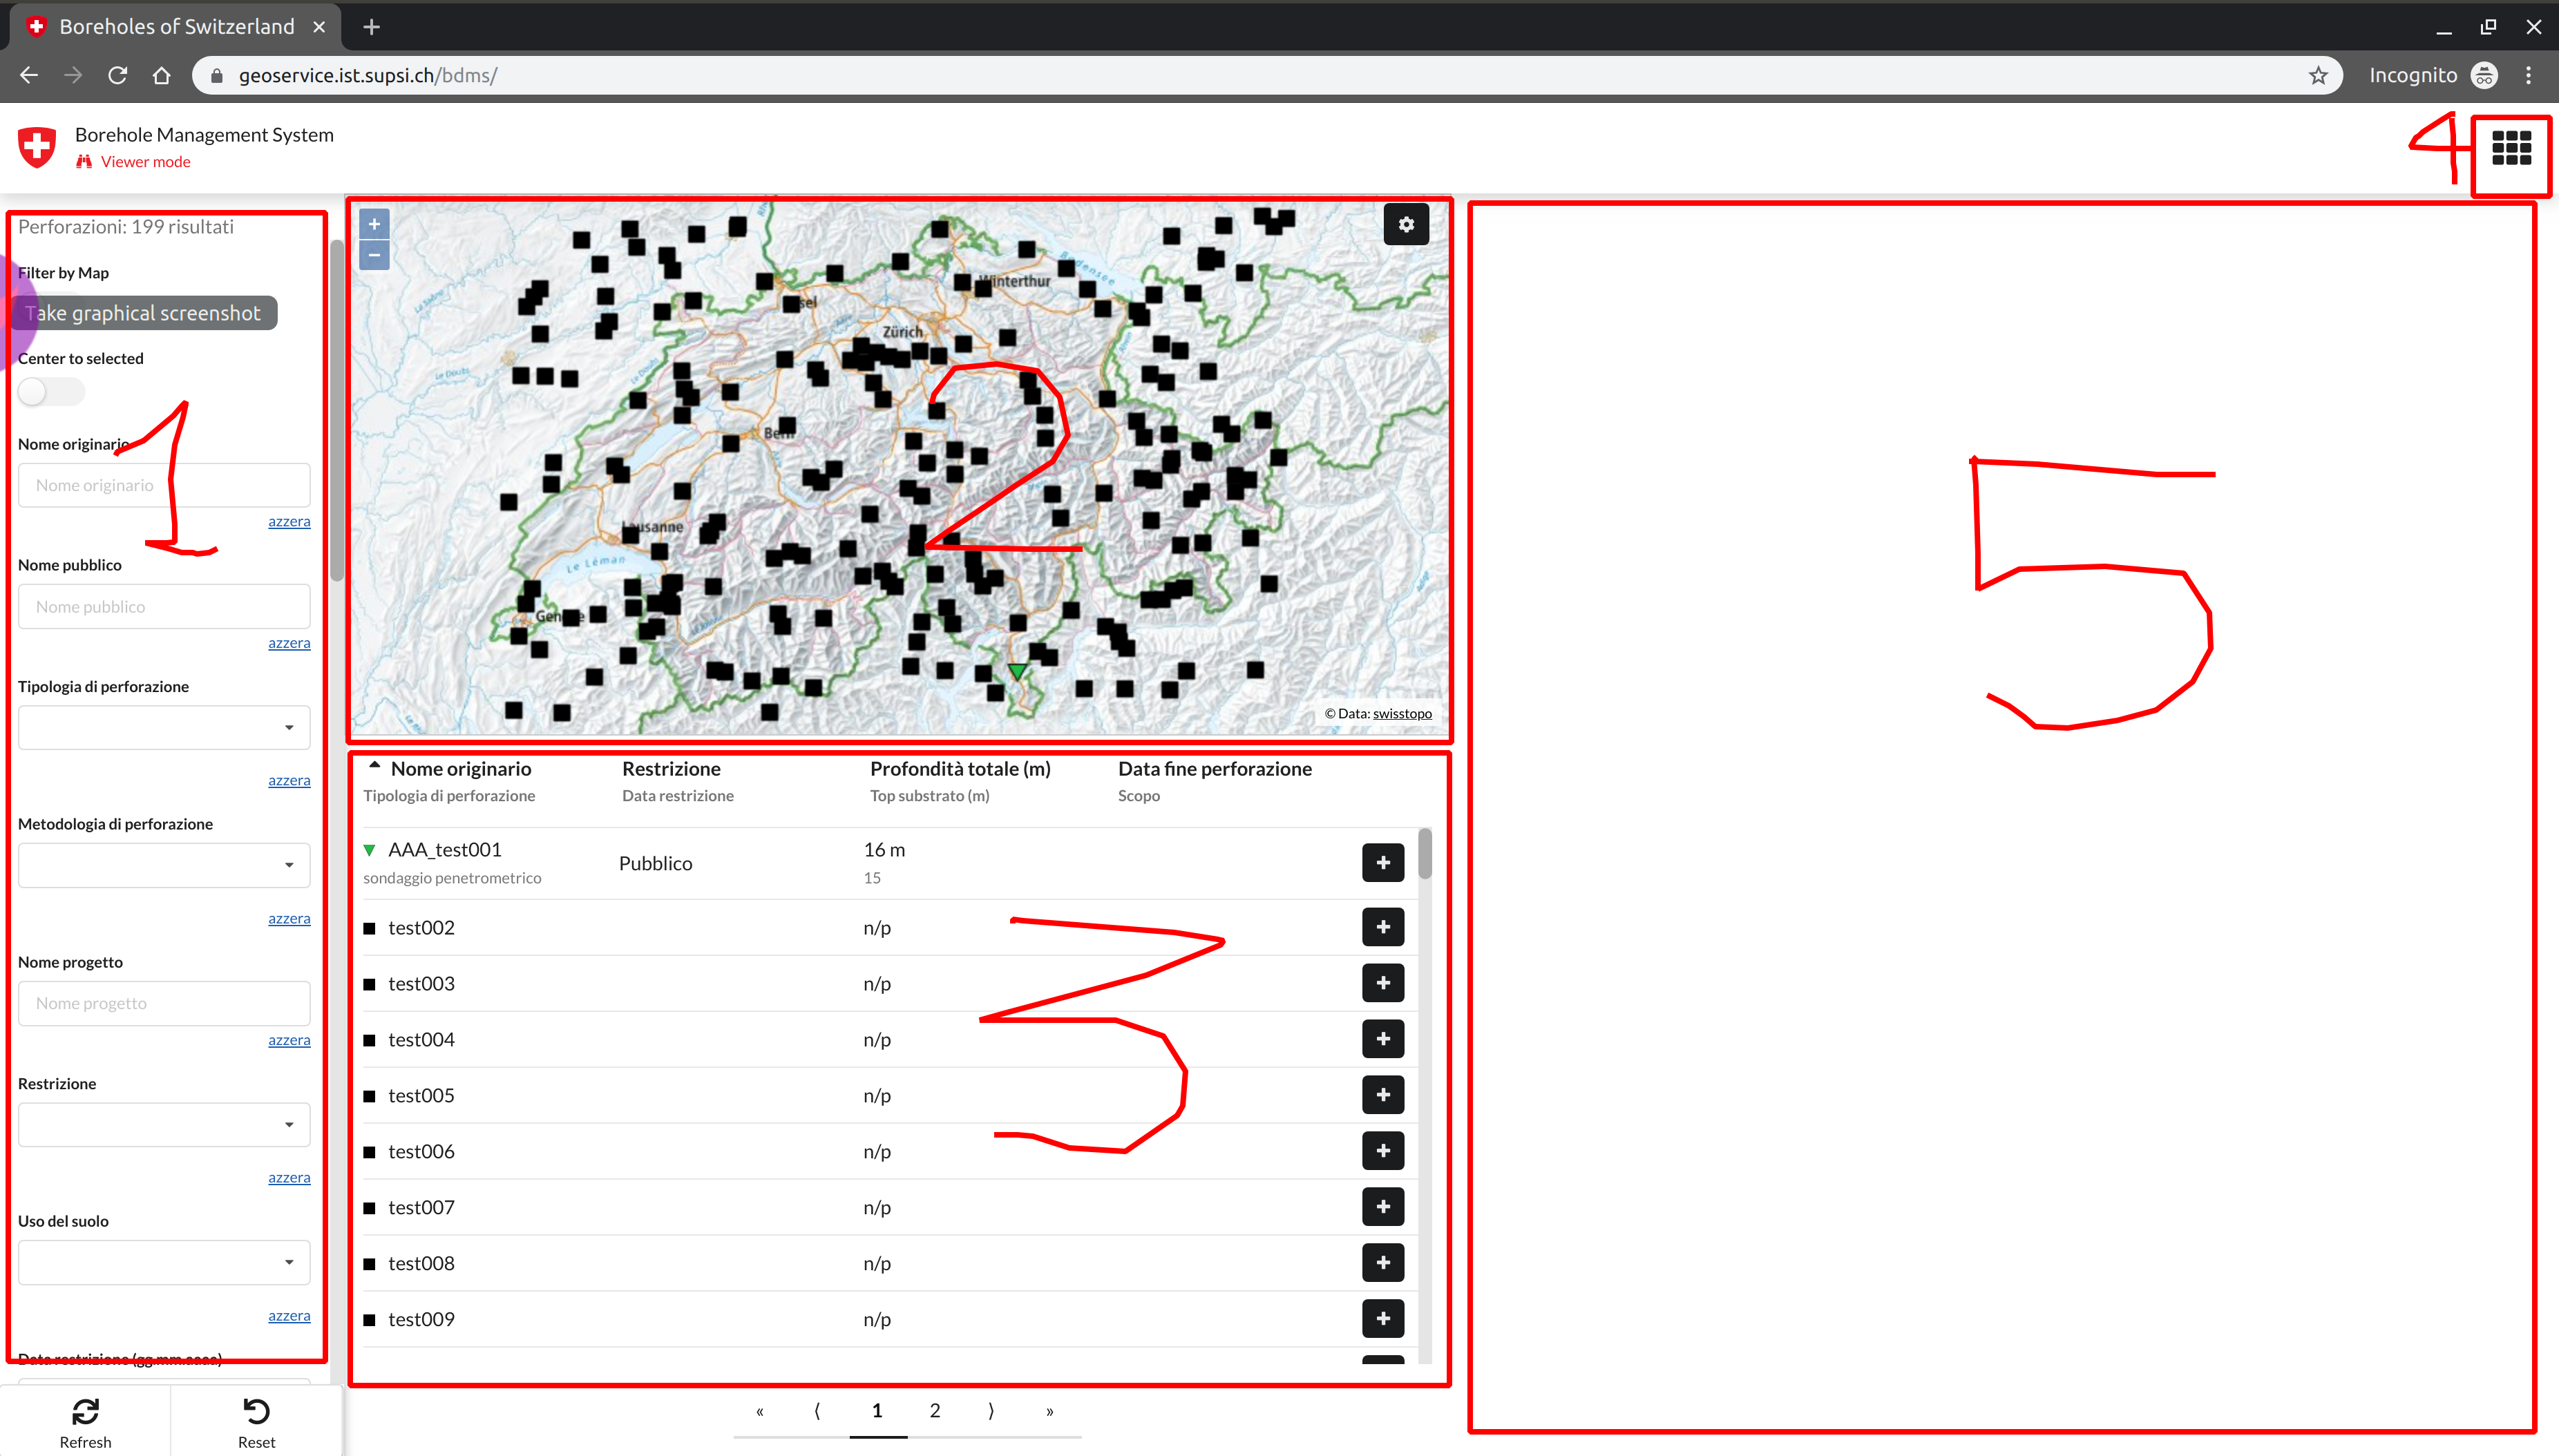
Open the link www. and you’ll se the following interface.

On the left, you have a filter panel (area 1), so that you can find the data fitting your needs or search criteria. By default all the existing fields can be used as a filter.
Note that the first two items set filtering option:
- filter by map: the table shows only data represented in the current map area
- center to selection: when you select a table row the map get centred on its location
As you can see, data are represented on a map (area 2) and in a table (area 3) according to applied filters.
On the right side of the page there is context panel (area 5) that is dedicated to present brehole data details of selected row. Note that at strat-up this area is empty.
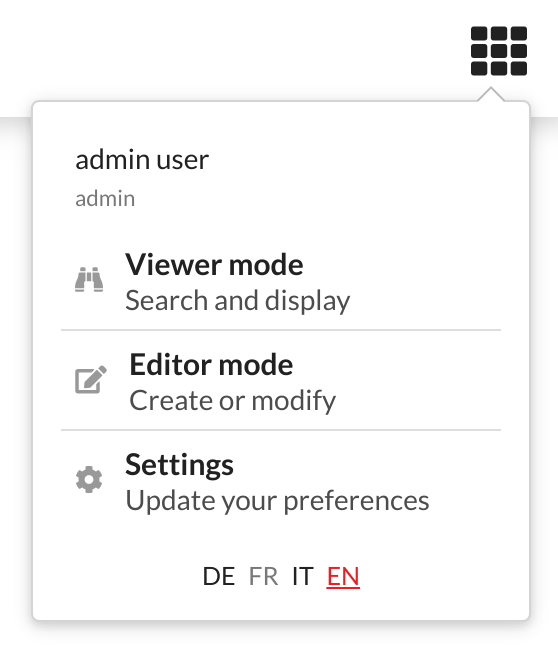
On the top right there is the mode menu (area 4) which permits to select the application mode you want (according to your authorizations) activate.

Specifically a user can select the:
- viewer mode: this activates the viewer mode interface (enabled by default as the landing page of the application) that will permit to search, view and download data [data access]
- editor mode: this activates the editing mode interface that will permit to insert new data and modify existing ones [data editing]
- settings: this activates the setting interface that allows to adjust the user preferences for the different interfaces in term of appearance, maps, filters and fields. If you have administrative privileges, you can also manage users and permissions.